
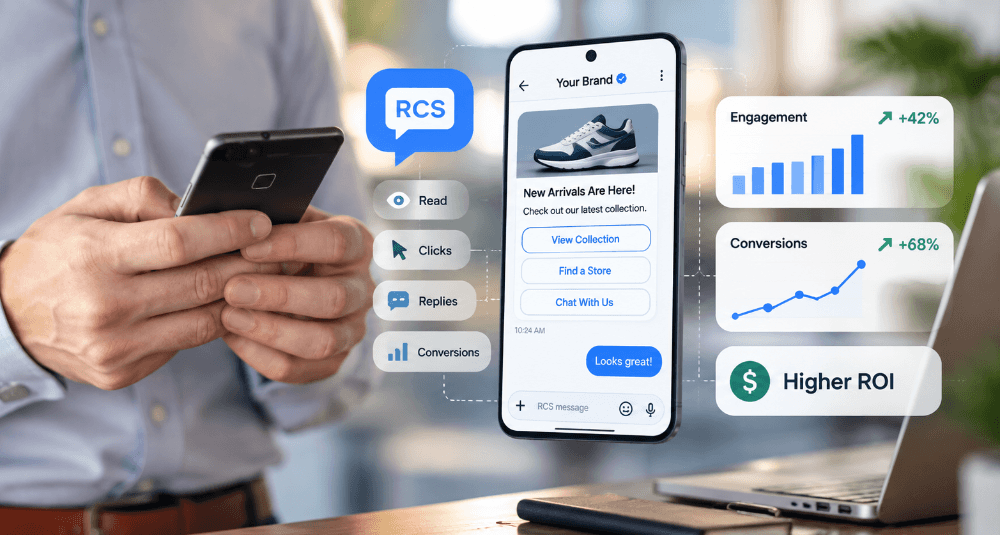
RCS marketing gives brands something SMS has historically struggled to provide: richer interaction data.
Businesses can track delivery, reads, replies, suggestion taps, conversation activity, rich-media engagement, and other events inside an RCS customer journey. Moreover, Google continues expanding RCS for Business reporting and billing visibility, making performance and cost analysis increasingly important for marketers heading into 2027.
In August 2026, Google introduced partner billing reports that provide aggregated daily counts of billable events grouped by agent, event type, and carrier. These reports add another layer of traffic and cost visibility for RCS partners.
However, more data doesn’t automatically lead to better decisions. Brands still need a clear attribution framework that connects messaging activity with leads, bookings, purchases, and revenue.
What Is RCS Analytics?
RCS analytics refers to measuring customer activity and technical performance across RCS campaigns and conversations.
Unlike basic SMS reporting, RCS can expose a wider range of interaction signals. Depending on the implementation, marketers may track:
- Messages sent
- Messages delivered
- Messages read
- Customer replies
- Suggested-action taps
- Rich-card interactions
- Carousel engagement
- Conversation starts
- Unsubscribes
- Delivery failures
- Revenue or conversions after interaction
Google’s RCS for Business infrastructure can send webhook events for user interactions and platform events, while agents can also receive delivery and read notifications.
As a result, marketers can measure not only whether a message reached a device but also how users interacted after delivery.
Why RCS Measurement Is Becoming More Important
RCS campaigns often contain richer creative elements than SMS.
A brand may use:
- Product images
- Carousels
- Suggested replies
- Call-to-action buttons
- Location actions
- Rich cards
- Conversational flows
So a simple “messages delivered” metric doesn’t explain whether the campaign worked.
For example, two campaigns may each deliver 100,000 messages. However, one may generate twice as many product-card taps and significantly more purchases.
That means RCS measurement should answer three different questions:
- Did the message reach the customer?
- Did the customer engage with it?
- Did that engagement create business value?
This framework keeps marketers focused on outcomes, not vanity metrics.
Start With Delivery and Read Metrics
Delivery performance forms the first layer of RCS measurement.
A campaign cannot produce engagement if the message never arrives. Therefore, brands should monitor delivery rate, failed delivery volume, carrier performance, and message expiration.
RCS also adds read events, which provide a stronger signal than delivery alone.
For example:
| Metric | What It Tells You |
|---|---|
| Sent | How much traffic the campaign generated |
| Delivered | How many messages reached recipients |
| Delivery rate | Overall technical success |
| Read | Whether users opened the message |
| Read rate | How many delivered messages were viewed |
| Failed/expired | Where technical issues occurred |
Google’s activity logs can include events such as delivery_receipt_event, read_receipt_event, suggestion_tap, rich_card/carousel, and spam_report.
As a result, brands can investigate the performance of individual interaction types instead of relying only on aggregate sending volume.
Track Suggested Actions and Rich-Content Engagement
RCS becomes especially valuable when customers can interact directly inside the message.
For instance, a retailer may show a carousel with several products. Meanwhile, a hotel may present buttons for “Book Now,” “View Rooms,” or “Call.”
Therefore, brands should track interactions at the component level.
Useful metrics include:
- Button tap rate
- Suggested-reply rate
- Carousel card engagement
- Product selection rate
- Call initiation rate
- Map or location action rate
- URL click rate
These metrics reveal which elements actually move customers forward.
For example, if customers frequently view a product carousel but rarely tap the checkout button, the issue may not be the campaign reach. Instead, the offer, pricing, or CTA may need improvement.
Measure Conversation Quality, Not Just Message Volume
RCS can support multi-turn customer conversations.
Therefore, brands should treat conversation quality as a separate performance category.
Useful conversational metrics include:
- Conversation start rate
- Average messages per conversation
- Customer reply rate
- Agent response time
- Resolution rate
- Escalation to human support
- Conversion after conversation
- Opt-out or spam-report rate
Google distinguishes between conversational and non-conversational agent billing models. Non-conversational agents generally generate billable events per delivered message, while conversational agents can generate billable conversation events based on 24-hour interaction windows.
Consequently, marketers should understand both engagement and billing structure when evaluating conversational campaigns.
Google’s New Billing Visibility Changes ROI Analysis
One of the most timely developments involves Google’s expanded billing reporting.
On August 25, 2026, Google announced partner billing reports that summarize daily billable events by agent, event type, and carrier. The reports arrive as CSV files through Google’s SFTP service.
The summary includes fields such as:
- Agent ID
- Agent name
- Carrier
- Country
- Event type
- Event count
- Billing date
- Start date
- Segment count for applicable U.S. events
This visibility matters because RCS cost analysis can get complicated when campaigns include multiple message types, carriers, countries, and conversational sessions.
Moreover, Google records billable A2P activity based on delivery time, not send time. Therefore, a message sent at the end of one month but delivered in the next month may appear in the later billing period.
Brands should account for this delay when reconciling campaign spend with internal reporting.
Connect RCS Events With Conversion Data
Messaging analytics become more valuable when brands connect RCS activity with downstream outcomes.
Suppose a customer:
- Receives an RCS promotion.
- Reads the message.
- Taps a product card.
- Visits the website.
- Completes a purchase.
The brand should connect that journey to a campaign ID, customer record, or tracking parameter.
Common attribution methods include:
- UTM-tagged URLs
- Unique campaign links
- CRM campaign IDs
- Coupon codes
- Session identifiers
- Conversion APIs
- First-party customer IDs
- Ecommerce order matching
As a result, marketers can calculate more meaningful metrics such as revenue per delivered message or conversion rate per conversation.
Use a Clear RCS Attribution Model
Attribution becomes difficult when customers interact across several channels.
A person may first see an email, later receive an RCS message, visit the website through search, and finally purchase.
Therefore, marketers should choose a consistent attribution model.
Common approaches include:
Last-Touch Attribution
Credit goes to the final measurable interaction before conversion.
This model is simple. However, it may undervalue earlier RCS engagement.
First-Touch Attribution
Credit goes to the interaction that first introduced the customer.
This model works well for acquisition analysis but may undervalue later nurturing.
Multi-Touch Attribution
Several interactions receive partial credit.
Although more complex, this model often makes sense for long customer journeys.
Incrementality Testing
Brands compare customers who receive RCS messages with similar customers who do not.
This method can help answer a more important question: did the RCS campaign create additional conversions, or would those customers have purchased anyway?
Calculate RCS Marketing ROI
Brands should move beyond engagement and calculate actual financial return.
A basic formula is:
RCS ROI = (Revenue Attributed to RCS − RCS Campaign Cost) ÷ RCS Campaign Cost × 100
However, campaign cost should include more than message fees.
Consider:
- Platform fees
- Carrier charges
- Billable message or conversation events
- Creative production
- Automation costs
- Staff time
- Integration expenses
For example, if an RCS campaign costs $5,000 and generates $20,000 in attributed gross profit, the ROI would be:
($20,000 − $5,000) ÷ $5,000 × 100 = 300%
Still, marketers should use profit rather than gross sales whenever possible because revenue alone can exaggerate campaign performance.
Build an RCS Measurement Dashboard
A practical dashboard should combine technical, engagement, conversion, and financial metrics.
| Category | Key Metrics |
|---|---|
| Delivery | Sent, delivered, failed, read |
| Engagement | Taps, replies, carousel interactions |
| Conversation | Starts, replies, resolution, escalation |
| Conversion | Leads, bookings, purchases |
| Revenue | Revenue per campaign, revenue per conversation |
| Cost | Billable events, platform fees, cost per conversion |
| ROI | Profit, return on spend, incremental lift |
This structure prevents teams from overvaluing a single metric.
For example, a campaign may achieve a high read rate but generate poor sales. Meanwhile, another campaign may produce fewer reads but a much stronger revenue-per-conversation figure.
RCS Analytics Should Focus on Business Outcomes
Google’s expanding reporting and billing visibility gives RCS marketers better operational data than they had only a few years ago.
Daily partner billing reports now provide clearer insight into event volume, carrier activity, and billable traffic. Meanwhile, delivery events, read receipts, suggestion taps, rich-card interactions, and conversational data create a deeper engagement picture.
However, the most important metric remains business impact.
Brands should connect RCS activity with leads, purchases, bookings, retention, and profit. They should also compare RCS performance against SMS, email, push notifications, and other channels.
Ultimately, RCS analytics are most valuable when they answer a simple question: did this message create enough incremental customer value to justify its cost?
As RCS reporting matures, the brands that connect technical events, customer behavior, billing data, and revenue will have the clearest view of messaging ROI.